How to Design an Infographic
Did you know that more than half of the global population are visual learners? With the human brain being able to process visuals 60,000 times faster than text, this comes as no surprise. However, these statistics are certainly changing the way audiences consume information. This is where infographics come into play, as they provide viewers with a quick and easy visual representation of information or data. By taking advantage of the brain’s ability to see patterns and trends, infographics are one of the most effective ways to get your message across – minus the large chunks of text.
Want to create your own infographics but don’t know how to get started? BeFunky has all the templates, tools, and images you need to create your own infographics – without needing experience or expensive software. Keep reading and we’ll have you pumping out scintillating infographics in no time!
Creating Custom Infographics
Ready to customize your own Infographic template? We’ll walk you step by step through the entire process.
Step 1: Select a Template
Open the Graphic Designer at the top and click the Templates icon on the left menu, the third one down. Then click Search Templates > Social Media > Blog Images, or search for Infographics in the Search Stock Images field.
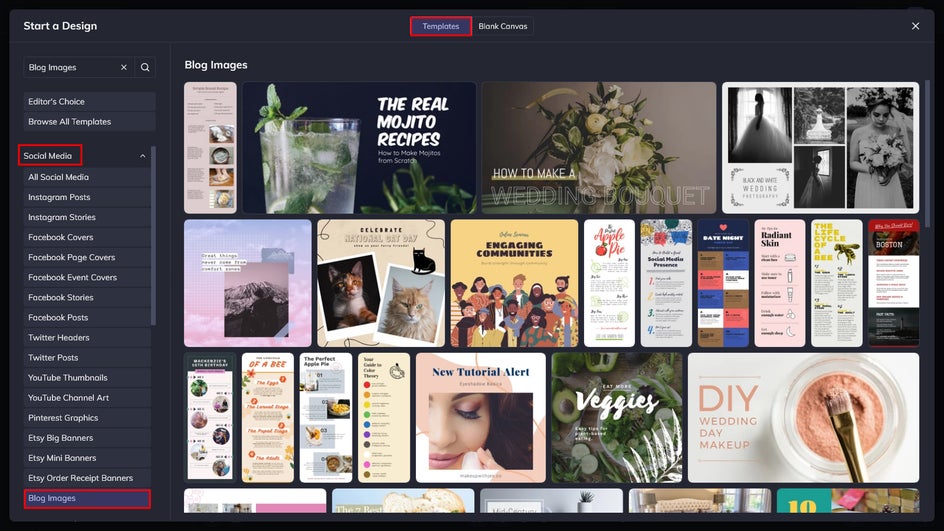
Select the template you want to use, then click Use This Template to begin the editing process. Once you have the template open, you can replace the existing text with your own content. Just double-click any text box and begin typing.
Step 2: Add or Replace Text
To add new text to your design, click the Text icon in the main menu on the left, followed by Add Text. When you double-click a text box a Text Properties panel appears. This is where you can change things such as the font, size, spacing, color, and more.
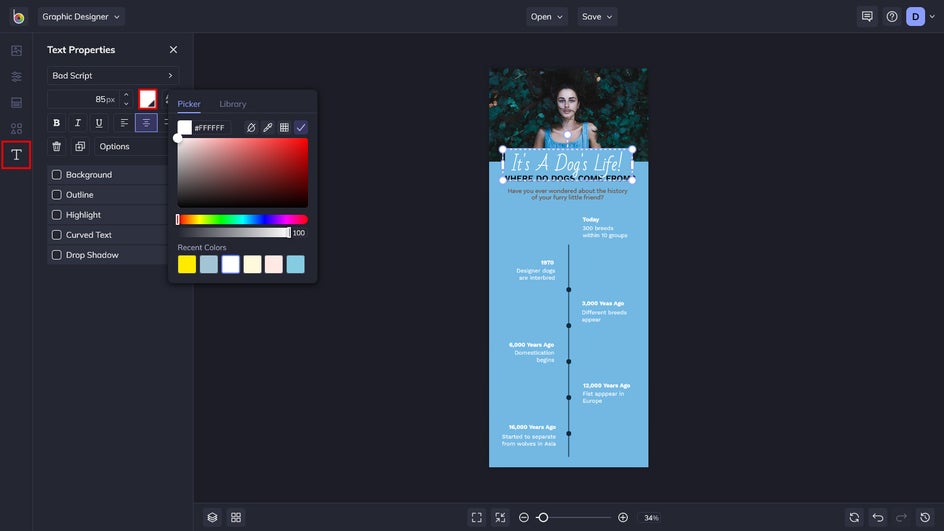
You can change the text color by clicking the color thumbnail. Then, choose a color from an image you placed on the template using the Eye Dropper Tool, or type in your desired color’s HEX Code. Using a color from a placed image will give your infographic cohesion.
Step 3: Add Your Images
Now let’s swap out the template’s existing photos for your own. To do this, click an existing photo, then from the drop-down Image Properties menu, click Replace. This allows you to open a photo directly from your computer.
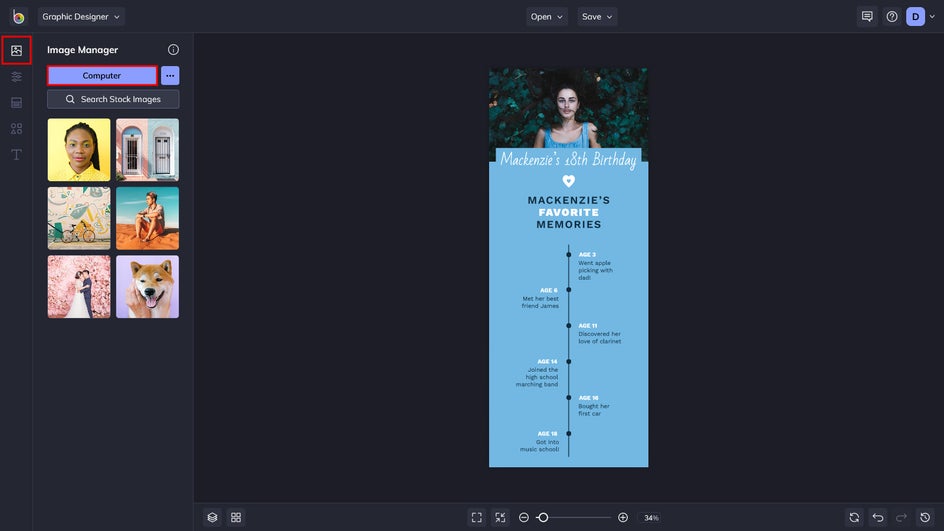
You can also click the Image Manager icon in the main menu on the upper left. Here, you can upload a photo from your BeFunky account, your Computer, Facebook, or Google Photos.
Or access our huge Stock Image Library by clicking Search Stock Images. Type your search term into the Search field at the top-left or choose from the Popular Searches tags below.
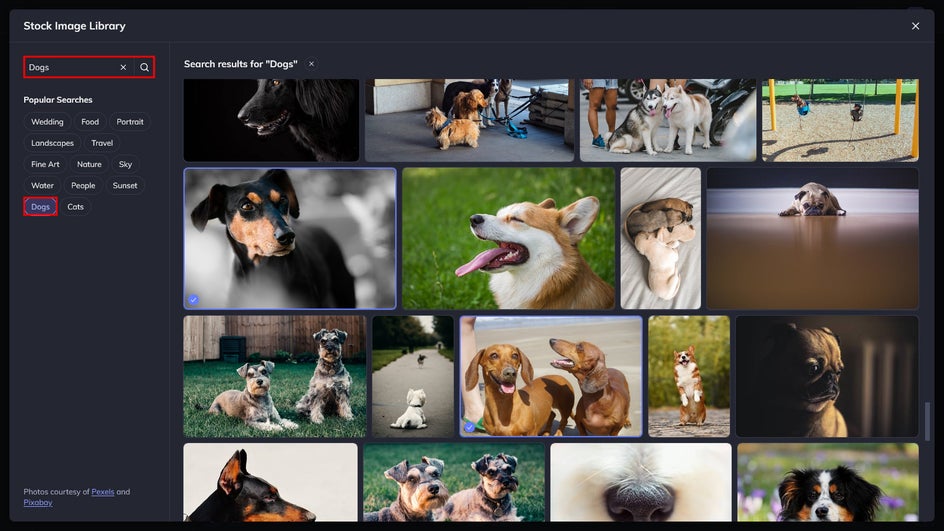
When you have image selects that you like, click to add them to your Image Manager. A blue checkmark in the corner lets you know you have a selection. From here you can drag and drop onto another image, a shape, or text to fill it with your image. Or double-click an image to add it to your canvas.
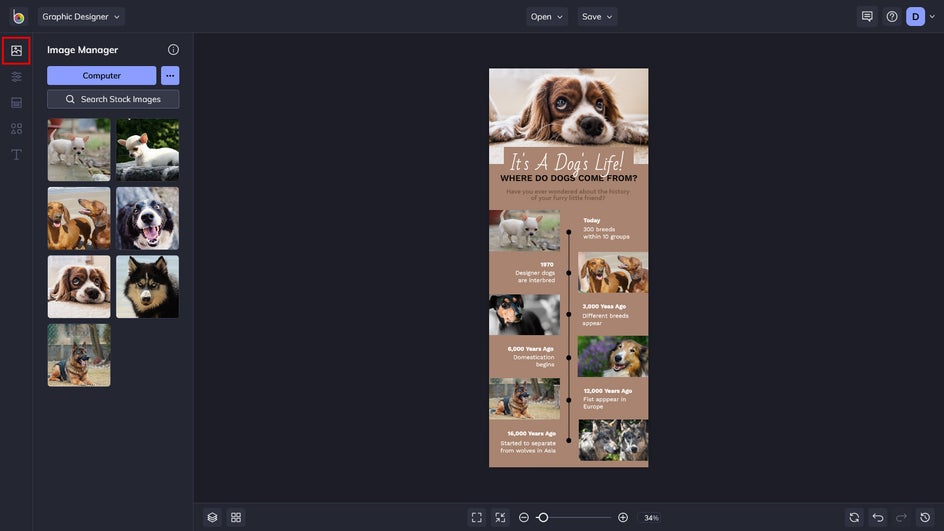
We’ve added stock images to our Infographic by placing them directly on the canvas. Our top image was replaced by dragging it over the placeholder. We've also changed the background color to better suit these images.
Step 4: Add Graphics
BeFunky also has a massive library of graphics to choose from, filled with symbols, abstract elements, illustrations, shapes, and more. To access this, click the Graphics tab on the left-hand side, then click Search Graphics.
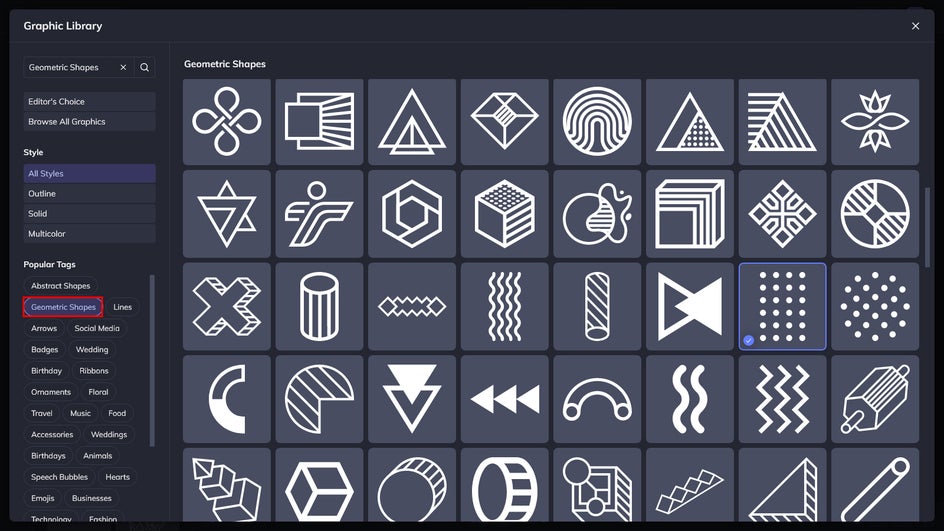
Now type a search term, filter graphics by style, browse Popular Tags, or peruse the Editor’s Choice graphics. Then simply click any graphics you want to use. These will be added to Your Graphics in the Graphics tab, where you can drag and drop them onto your canvas.
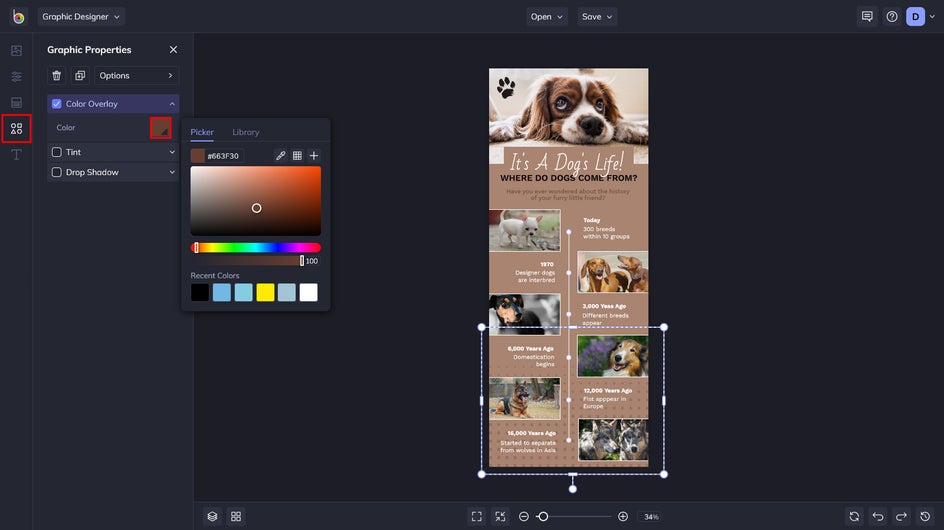
Ready to change the colors of your Graphics? Click on the graphic, then from the Graphic Properties panel, click on the color square to adjust the Color Overlay or Graphic Colors. Then select a color, use the Eye Dropper Tool, or type in a HEX Color Code.
Step 5: Save and Share
Once you’ve completed your infographic, it’s time to save your design. Click the Save button in the upper middle, followed by Save as Project in the drop-down menu. This saves the project in an editable format where you can change the content, or use it as your own template for later designs.
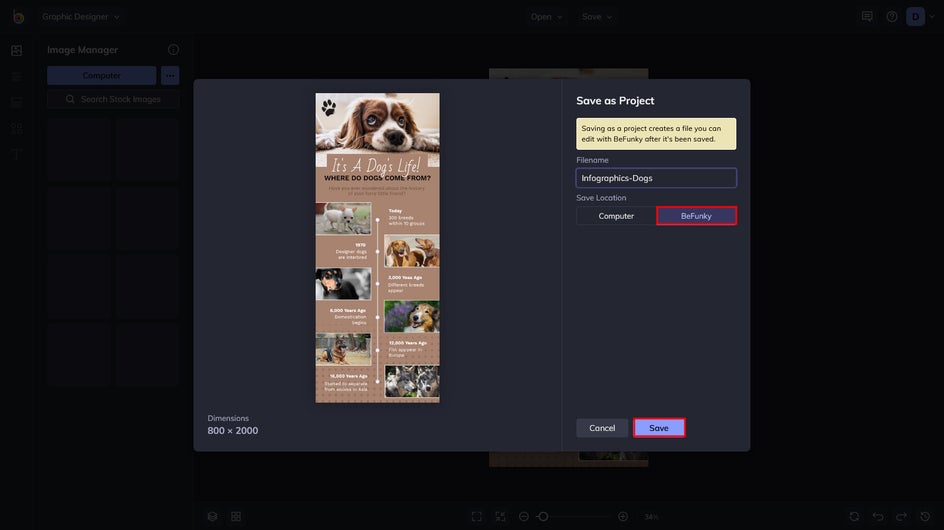
You can save it to your computer, Google Drive, or BeFunky for later use. Or, share a flattened version directly to Pinterest, Twitter, or Facebook under the More drop-down menu.
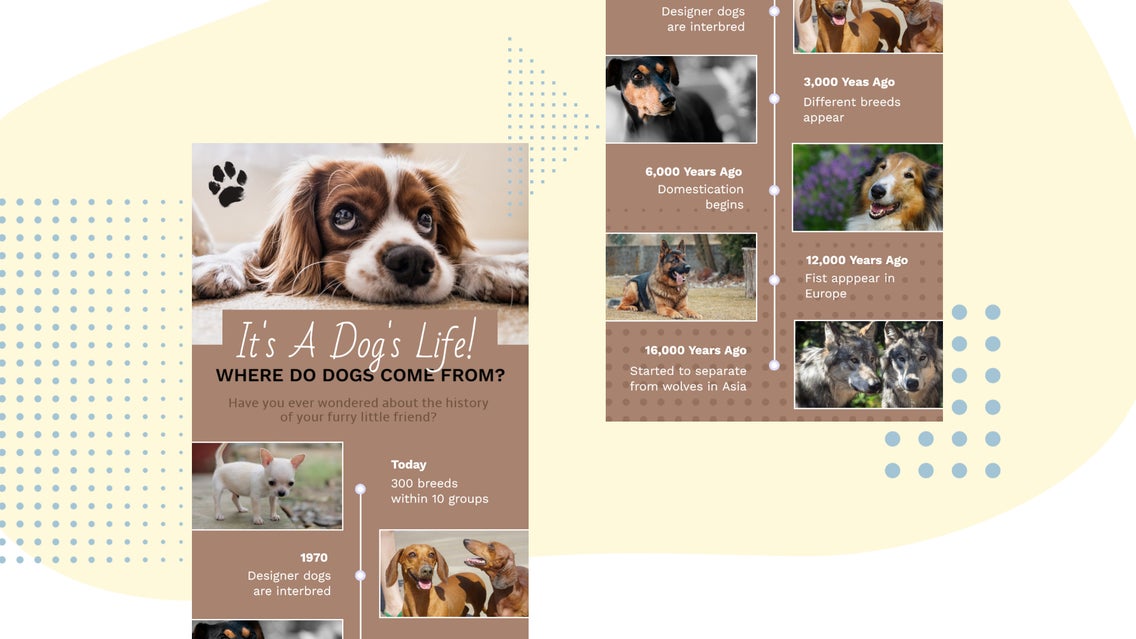
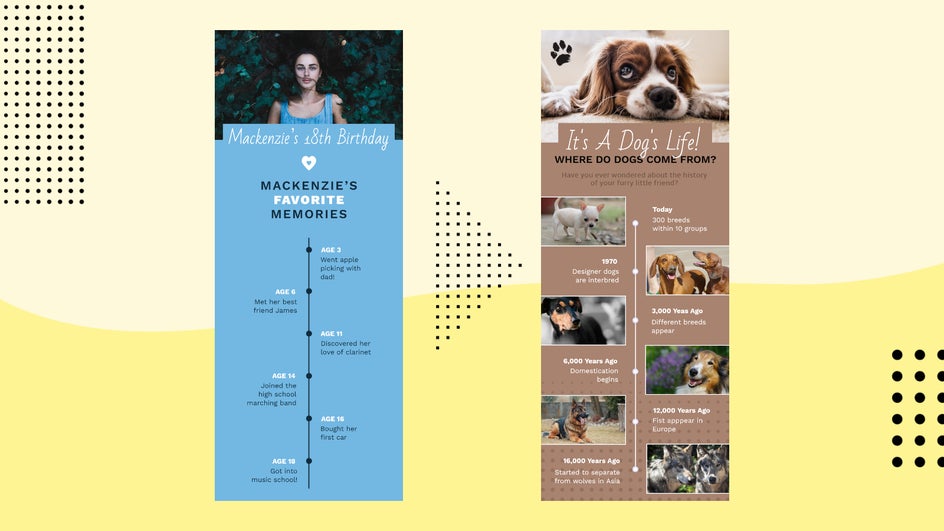
An Original Timeline Infographic
Now wasn’t that easy? We've transformed this timeline infographic template to fit a different story, while maintaining the same formatting. You can check out the Infographic Maker and follow the steps above to create your own professional-looking Infographics!
Infographic Inspiration
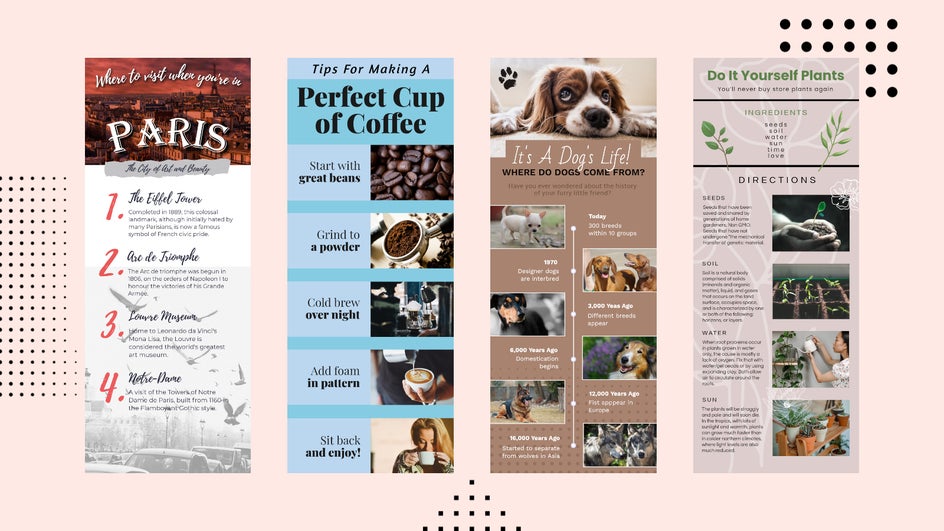
Interested in more Infographic design inspiration? Here, we've made infographics with several different templates to help you find what works best for your projects.
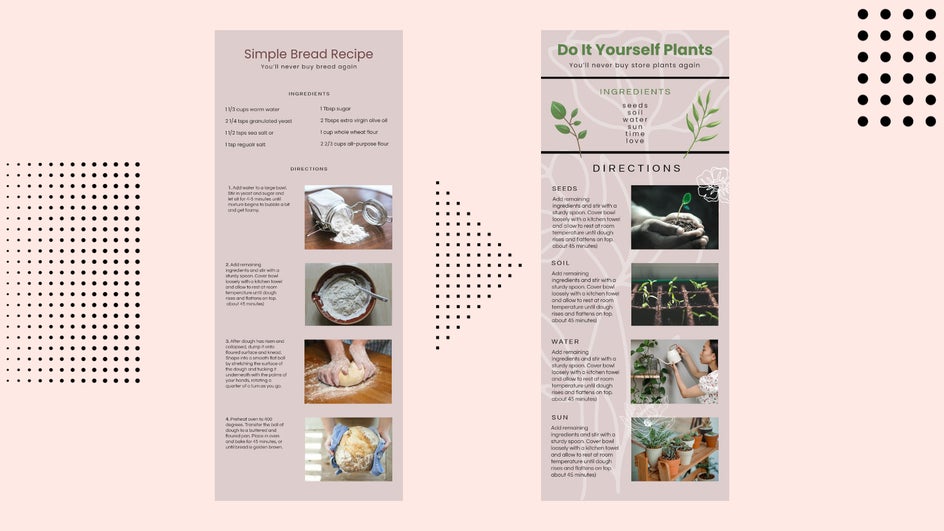
DIY Tutorials
DIY tutorials are immensely popular as they allow an audience to see the step-by-step process for creating something. By breaking down a large task in an Infographic format with smaller steps helps to make difficult projects seem doable. This template works well for any "How To" style article, making it a must-have for those in the blogging world.
Top Tips
Have you written a longer article outlining your top tips about a particular topic, or want to share your expertise in a bite-sized format? This template style is perfect for easily getting your message across.
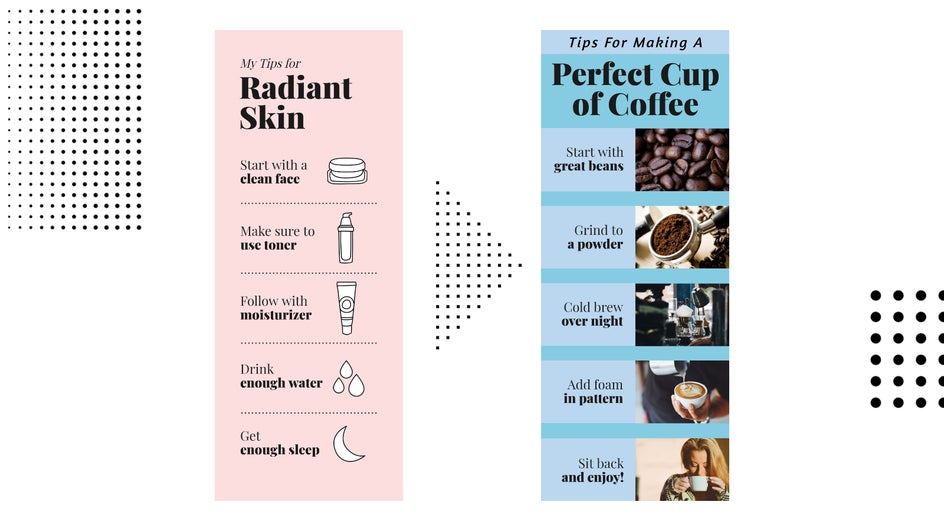
While it might be a bit more text-heavy than other templates, this makes it ideal for content that doesn’t lend itself to the more visual nature of a DIY tutorial or visual timeline.
Lists
These templates are great for showing content in list format. Keeping the content interesting with related imagery allows the reader to absorb the data quickly.
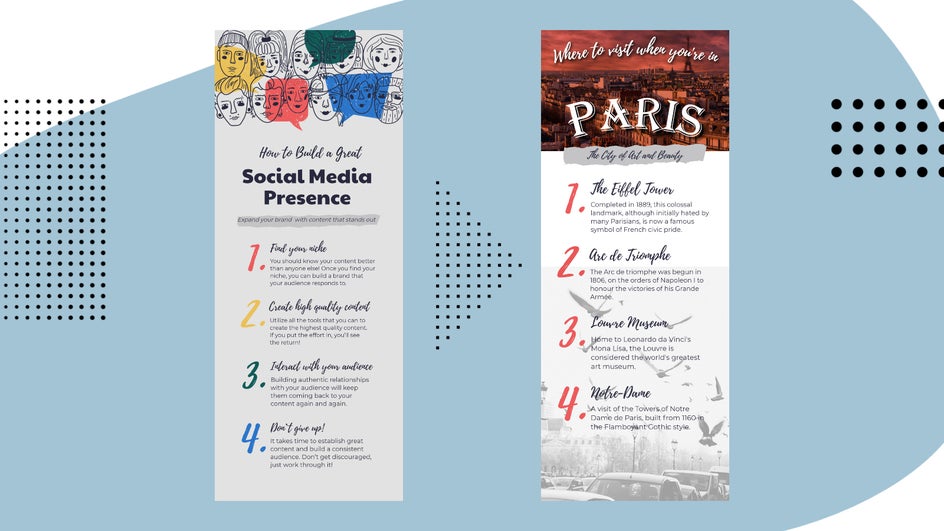
BeFunky’s list-style templates are also good for summarizing lengthier advice articles.
Create Beautiful Infographics With Befunky
Getting your message across effectively by taking advantage of our easy-to-use Infographic templates will help boost your engagement! BeFunky’s drag-and-drop simplicity is the quickest way to create gorgeous and shareable content!